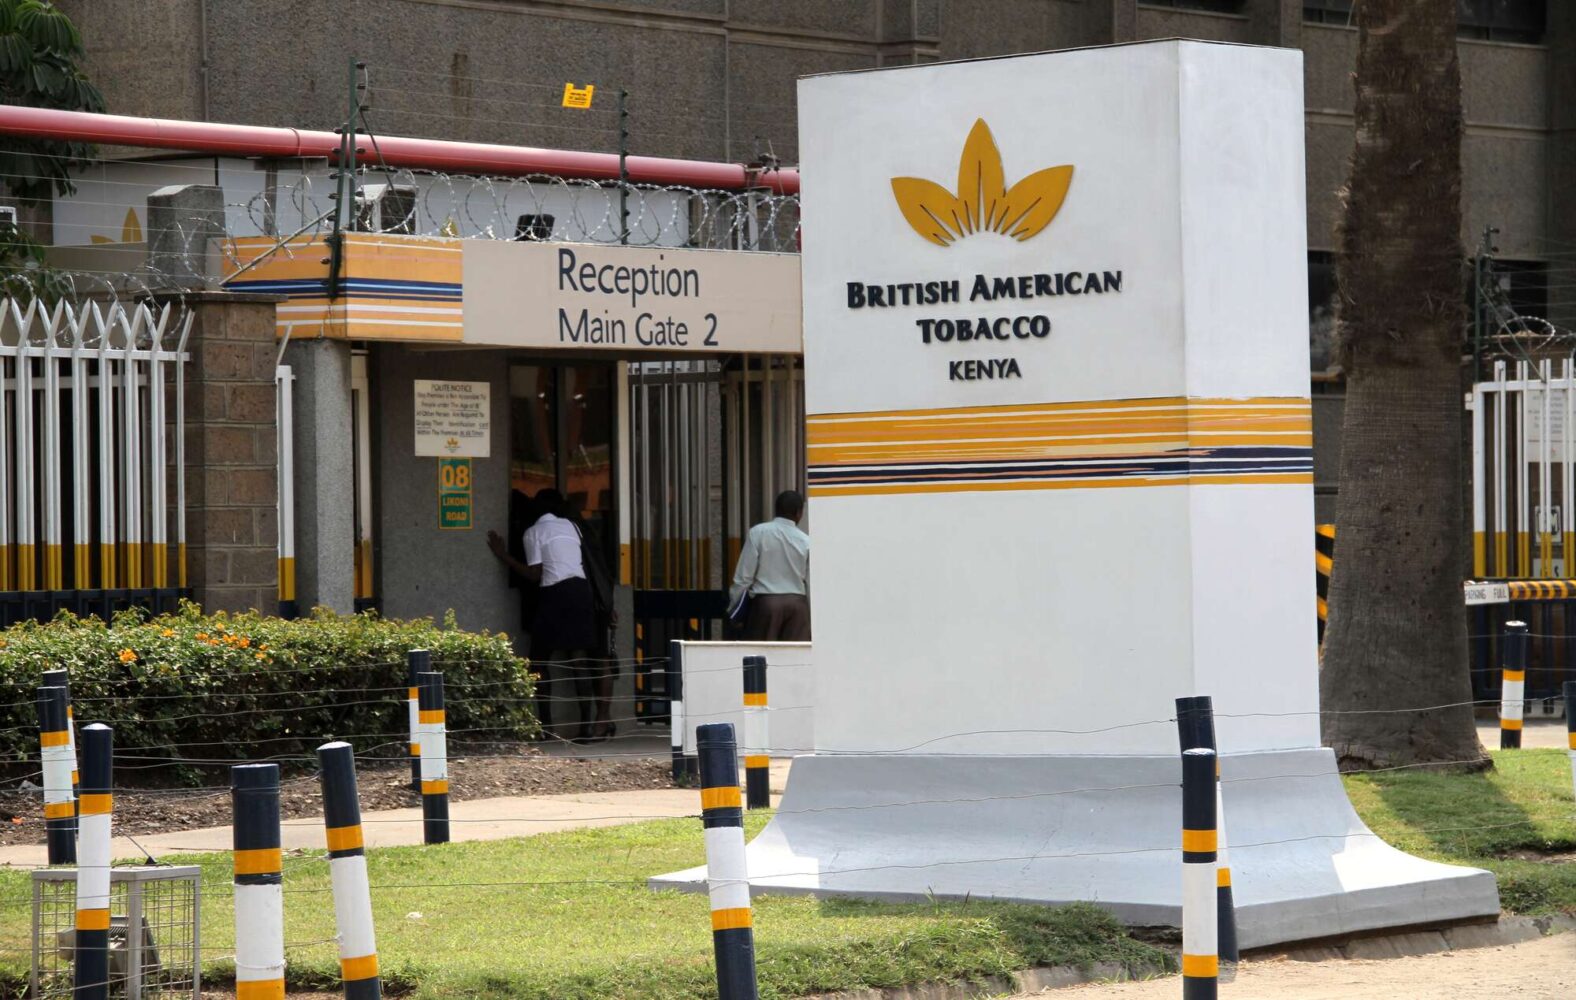
Forget tobacco. The only thing lighting up at BAT Kenya this half-year is their profit margin and unlike a pack of cigarettes, this growth comes with a healthy yield.
With net revenue barely flickering upward by 0.1% to KES 11.7 billion, it’s not the sales that fueled the flame-it’s what the company inhaled from its balance sheet.
In 1H25, BAT Kenya reported a KES 3.0 billion profit, marking a 39.7% year-on-year surge in after-tax earnings. The secret? A finance flip that would impress even the slickest fund manager.
Instead of coughing up KES 720 million in finance costs like last year, BAT Kenya raked in KES 97 million in finance income-an earnings reversal of over KES 817 million.
Earnings per share (EPS) OF BAT
Earnings per share (EPS) smoked past expectations, landing at KES 29.83, a 39.7% y-o-y rise that mirrors the after-tax profit surge. This despite net revenue barely glowing-up just 0.1% y-o-y to KES 11.7 billion.
The reason? A 5.9% dip in gross revenue to KES 18.5 billion, weighed down by consumer downtrading, a strong shilling, and softer domestic demand.
Excise Duty and VAT
Excise Duty and VAT slid 14.8% y-o-y to KES 6.8 billion, helping cushion the revenue stagnation. And just as the embers cooled, the company reignited market interest in June 2025 by resuming sales of its modern oral nicotine pouches-a strategic pivot with long-tail implications.
Operational Efficiency
Cost of operations trimmed by 5.5% y-o-y to KES 7.5 billion, thanks to prudent belt-tightening and productivity gains.
The operating profit margin revved up by 382 bps to a sharp 36.0%, a high that outpaces industry norms.
Finance Income vs. Cost
Stable exchange rates played wingman here. Finance income hit KES 97.0 million, while finance costs fell to KES 720.0 million, a hefty swing from last year-all thanks to the KES flexing muscle against the USD.
Balance Sheet Check-In:
- Total assets rose 3.4% y-o-y to KES 23.1 billion.
- This came with a 15.3% drop in non-current assets (KES 9.7 billion) and a 23.3% rise in current assets (KES 13.3 billion)-a liquidity play with teeth.
- Liabilities ticked up 5.5%, driven by 16.2% growth in current liabilities (KES 6.3 billion), offset by a 19.0% dip in non-current liabilities (KES 1.9 billion).
- Shareholders didn’t miss out-funds grew by 2.2%, totaling KES 14.8 billion by half-year close.
Price-to-Earnings (P/E) ratio
With a P/E ratio of 7.1x, BATK is priced slightly above the sector’s 7.0x median-suggesting investors are willing to pay a premium for the earnings quality. But here’s where it gets smokier: BATK’s Price-to-Book (P/B) ratio is 2.6x, nearly triple the sector median of 1.0x, showing that the market sees stronger intrinsic value in its operations and asset efficiency.
Returns
- Return on Equity (ROE): 36.1% vs. sector’s 8.3%
- Return on Assets (ROA): 23.1% vs. sector’s 7.1%
Higher ROE = better profit performance for each shilling of investor capital.
High ROA = efficient use of resources to drive earnings.
Dividends
After sipping margins with a teaspoon, BAT Kenya now serves dividends with a soup ladle. The board has approved an interim dividend of KES 10.00 per share up from KES 5.00 in1H24 which will be paid on or about 26th September 2025 to shareholders registered on the group’s register at the close of business on 29th August 2025.


