If economic growth is a measure of a nation’s vitality, what does a slowdown in key sectors reveal about Kenya’s current health and future trajectory?
In 2024, the Kenyan economy experienced a deceleration, with GDP growth dipping to 4.7% from the previous year’s 5.7%. This slowdown, particularly evident in sectors like construction and mining, was triggered by a confluence of challenges.
The slowdown in Kenya’s economic engine can be directly linked to several significant challenges.
First, the devastating floods of 2024 disrupted agricultural production and infrastructure, leading to supply chain disruptions and increased costs.
Second, the high interest rate environment, aimed at curbing inflation, also made borrowing more expensive, stifling investment and consumer spending. The resultant decline in business sentiment, fueled by social unrest and a cautious approach to government spending, further suppressed economic activity.
However, according to the CBK, leading indicators of economic activity point to improved performance in the first quarter of 2025. The resilience of key service sectors and agriculture, the expected recovery in the growth of credit to the private sector, improved exports, stable exchange rates, contained inflation, and improved FX reserves are all expected to support economic activity in 2025.
Central Bank Rate
In response to these challenges and with an eye toward future growth, the Central Bank of Kenya (CBK) implemented bold rate cuts. They decided to lower the Central Bank Rate (CBR), which is the interest rate at which commercial banks borrow money from the CBK.
The first cut was 0.5% (or 50 basis points), bringing the rate down from 11.25% to 10.75%. If a bank previously paid 11.25% interest to borrow money from the CBK, they now pay 10.75%.
They also reduced the Cash Reserve Ratio (CRR), which is the percentage of deposits banks are required to keep with the CBK. This was lowered from 4.25% to 3.25%. This means banks have more money available to lend out.
Despite these measures, the Non-Performing Loan (NPL) ratio, which measures loans that aren’t being repaid, rose to 17.2% by February 2025. Inflation, however, remained stable at 3.6% for the quarter.
Loan Book Growth and Demand in the Banking Sector
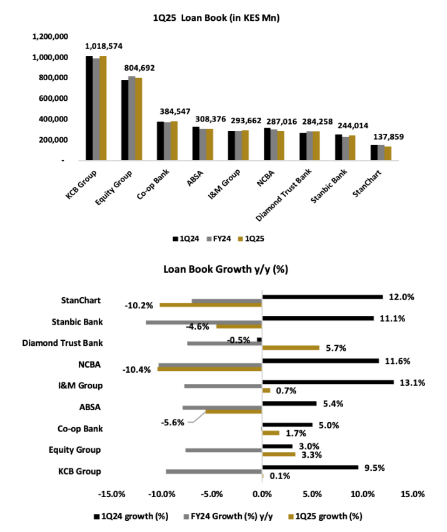
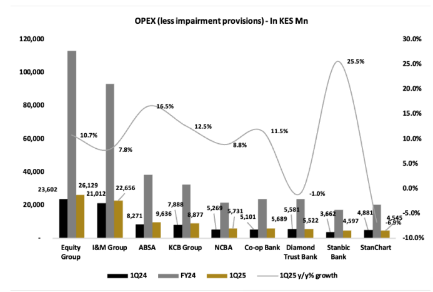
In the first quarter of 2025, total lending by commercial banks decreased by 0.8% compared to the same period the previous year (year-over-year or y/y). This is a significant change from the growth seen in the first quarter of 2024, when lending grew by an average of 7.8% y/y across the board.
This slowdown is due to less lending to the private sector, mainly because borrowing costs were high.
The CBK Credit Officer Survey for the first quarter of 2025 indicated an increase in the demand for credit in the Trade sector. This increase was mainly because businesses needed more working capital (money to cover day-to-day operations).
Bank Performance Highlights:
- DTB (Diamond Trust Bank): This bank had the fastest loan growth in the first quarter of 2025, increasing by 5.7% y/y. The bank’s management said they focused on lending in local currency, which helped stabilize their balance sheet and earnings.
- Equity Group: This bank saw the second-highest increase in lending, at 3.3% y/y. This growth was somewhat limited due to cautious lending practices and the impact of foreign exchange rates. However, when looking at the lending in constant currency (removing the effect of currency fluctuations), the group’s lending grew by 7.0% y/y. Specifically, lending in the Democratic Republic of Congo (DRC) increased by 11.0% y/y, in Rwanda by 36.0% y/y, and in Tanzania (TZ) by 20.0% y/y.
- Co-op Bank and I&M Group: These banks experienced modest loan book growth, with Co-op Bank increasing by 1.7% y/y and I&M Group by 0.7% y/y.
- KCB Group: Loan growth was slow at 0.1% y/y. However, when including the reclassification of assets and liabilities from NBK (National Bank of Kenya), gross loans grew by approximately 8.9% y/y. Management highlighted that loan growth was driven by disbursements (issuing of loans) in key sectors in Kenya, Tanzania, Uganda, and Burundi.
- NCBA, StanChart, Absa, and Stanbic: These banks saw a decrease in their loan books: NCBA (-10.4% y/y), StanChart (-10.2% y/y), Absa (-5.6% y/y), and Stanbic (-4.6% y/y). This decline is likely due to the Kenyan Shilling (KES) becoming stronger against major currencies, which reduced the value of their foreign currency (FCY) loan books when converted to KES.
Customer Deposits in the Kenyan Banking Sector
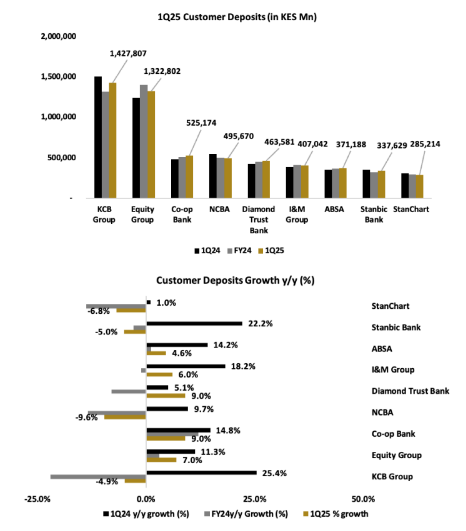
Total customer deposits across the analyzed banks increased marginally, growing by only 0.8% year-over-year (y/y) to reach KES 5,636.1 billion. This indicates a general lack of significant deposit growth across the sector.
Top Performers:
- DTB and Co-op Bank led the pack in deposit growth, with a strong 9.0% y/y increase. This growth was likely fueled by expansion initiatives aimed at attracting a wider customer base, as well as increased institutional and government banking deposits.
- Equity Group, I&M, and Absa also saw positive growth in customer deposits, with increases of 7.0% y/y, 6.0% y/y, and 4.6% y/y, respectively. These banks benefited from their mobile and online banking services, which helped them mobilize liabilities effectively. Equity Group’s deposit base grew by 13.0% y/y when accounting for constant currency.
- Conversely, NCBA Group, StanChart, Stanbic Bank, and KCB Group experienced contractions in their deposit books, with decreases of 9.6% y/y, 6.8% y/y, 5.0% y/y, and 4.9% y/y, respectively. This was partially due to the impact of foreign exchange (FX) translation on foreign currency (FCY)-denominated deposits.
- KCB Group’s deposits grew by 2.0% y/y when excluding the impact of NBK reclassification and accounting for constant currency.
- Interest Expense Management: Some banks strategically reduced expensive deposits as interest rates declined. This helped them take advantage of higher margins in local currency (LCY)-denominated deposits, leading to a decrease in total interest expenses on customer deposits to KES 57.2 billion from KES 62.7 billion in the first quarter of 2024.
Interest Income and Interest Expenses in the Banking Sector
While the overall trend pointed towards a softening in interest income and a decline in interest expenses, individual banks experienced varying fortunes, shaped by factors such as Central Bank Rate (CBR) adjustments, investment strategies, and deposit management.
Interest Income:
Overall, interest income from loans and advances decreased to KES 127.3 billion, reflecting the impact of CBR rate cuts.
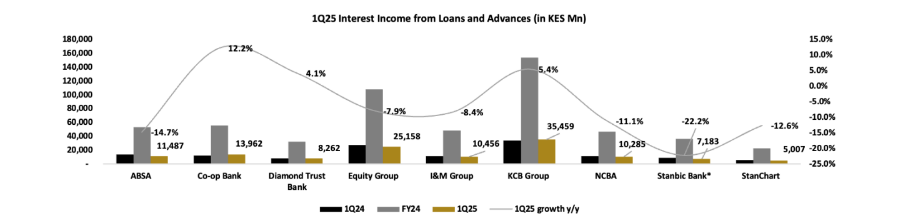
- Co-operative Bank: Showed impressive growth, with a 12.2% year-over-year increase in interest income from loans and advances.
- Stanbic Bank: Experienced the most rapid increase in interest income from government securities, surging by 127.9% year-over-year, driven by increased investment in government papers.
- KCB Group, DTB, and Absa: Reported a contraction in interest income from government paper, with declines of 7.9%, 7.0%, and 6.2% year-over-year, respectively.
Interest Expenses:
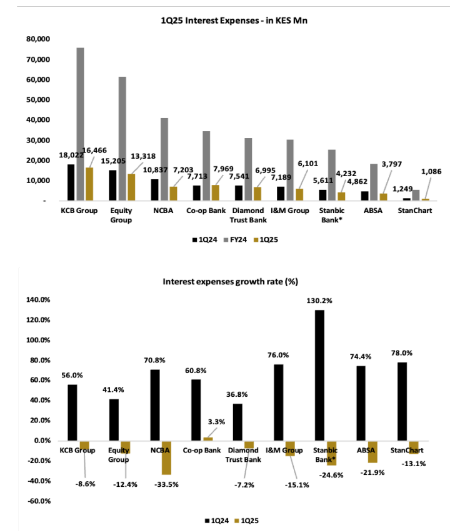
The sector saw a positive shift as interest expenses began to decline in the first quarter of 2025, with an overall decrease of 14.1% year-over-year to KES 67.2 billion. This contrasted with a significant average rise of 69.4% year-over-year in the first quarter of 2024.
- NCBA: Led the decline in interest expenses, dropping by 33.5% year-over-year, partly due to a 35.9% year-over-year decrease in interest on customer deposits. The bank also improved its Current Account and Savings Account (CASA) ratio.
- Co-operative Bank: Recorded a 3.3% year-over-year increase in interest expenses, influenced by an 8.9% year-over-year rise in interest expenses on customer deposits.
- KCB Group: Despite having the highest interest expense quantum (KES 16.5 billion), it saw a contraction of 8.6% year-over-year, supported by controlled interest expenses on customer deposits.
Total interest from other expenses (borrowings) and total interest expenses from deposits and placements decreased by 20.7% and 55.4% year-over-year, respectively.
Asset Quality and NPLs in the Kenyan Banking Sector
Total Gross NPLs across the covered banks reached KES 631.3 billion, marking a 7.3% year-over-year increase. This rise indicates that borrowers are struggling to meet their debt obligations, a situation likely exacerbated by higher borrowing costs and reduced consumer spending.
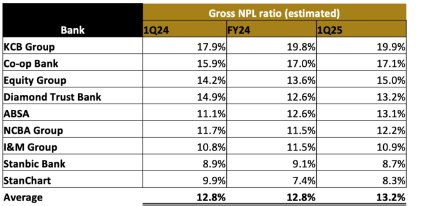
The average Gross NPL ratio also increased to approximately 13.2%, up from 12.8% in the previous quarter, further underscoring the growing pressure on asset quality.
Several sectors, including manufacturing, real estate, trade, personal & household, agriculture, and construction, experienced an uptick in NPLs. The industry NPL ratio peaked at 17.6% in April 2025, though it slightly decreased from February 2025.
Specific banks showed varying performances.
- Absa experienced the most significant increase in Gross NPLs, followed by KCB Group, Co-op Bank, Equity, and I&M Group. However, some banks, such as StanChart, DTB, NCBA, and Stanbic, managed to reduce their Gross NPLs.
This divergence suggests that individual banks are navigating the challenging economic environment differently, with some potentially more exposed to specific sectors or facing greater difficulties in managing their loan portfolios.
Provisioning:
Overall, total loan loss provisions decreased by 20.3% year-over-year to KES 17.9 billion, with an average decline of 14.4% across the covered banks. This decline contrasts with an average increase of 8.5% in the previous year, indicating a shift in the banks’ approach to managing credit risk.
Some banks, like Co-operative Bank and NCBA, increased their provisioning, reflecting a cautious stance. Others, such as I&M, increased provisions modestly, aligning with their relatively small increase in Gross NPLs.
Conversely, several banks, including Absa, Equity Group, DTB, Stanbic, StanChart, and KCB Group, reduced their provisioning levels. This could signal confidence in improving asset quality, potentially driven by expectations of economic recovery or successful debt management strategies.
Absa’s significant reduction in provisioning, despite a rapid rise in NPLs, suggests possible recoveries, write-offs, or a strategy to increase provisioning in subsequent quarters.
Operational Efficiency in the Banking Sector:
Total operating income across the coverage remained relatively stable, with a slight increase of 0.6% year-over-year, reaching KES 196.7 billion. However, beneath this surface, significant variations emerged in how banks managed their operational costs and income generation.
Several banks demonstrated resilience and improvement.
Co-op Bank led the pack with the most significant jump in operating profit, followed by I&M Group, NCBA, and KCB Group. These banks benefited from improved net interest margins, thanks to eased interest expense pressures.
Cheaper liabilities combined with steady interest income from government securities further boosted their operating income performance.
Conversely, the average cost-to-income ratio across the coverage deteriorated to 46.3% in the first quarter of 2025, up from 42.8% in the same period of the previous year. This was partly due to sluggish income performance during the period, despite operating expenses remaining largely steady.
- Absa stood out as the most efficient, boasting a cost-to-income ratio of approximately 35.0%. This was driven by a single-digit rise in operating expenses (excluding provisions) and a focus on technology adoption.
- I&M Group was the only lender that improved its cost-to-income ratio, decreasing to 43.5% in the first quarter of 2025, from 44.2% in the previous year. This was achieved through higher income, despite a notable increase in operating expenses.
- However, Stanbic experienced the most significant increase in its cost-to-income ratio, primarily due to lower income and higher operating expenses.
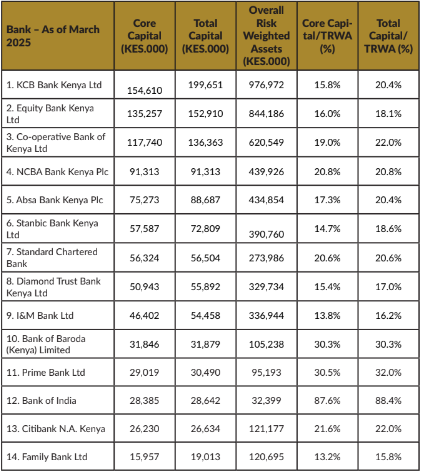
Capital Buffers and Liquidity in the Banking Sector
The Kenyan banking sector has demonstrated resilience in the face of various economic challenges, as evidenced by the robust capital buffers maintained by most banks. The overall total capital for the banks under review reached KES 1,220.7 billion, marking a significant 10.8% year-on-year increase.
This growth highlights the sector’s strong capital positions, enabling them to absorb potential losses and support lending activities.
- KCB Kenya, for example, saw its total capital surge to KES 199.7 billion, a 22.7% year-on-year increase, fueled by a recovery in income performance and the strategic withholding of dividend payments.
- Equity Bank Kenya experienced a slight dip in total capital, primarily due to a contraction in supplementary capital, potentially influenced by foreign exchange impacts on its long-term borrowings and the retirement of certain loans.
The Central Bank of Kenya’s recent directive for lenders to submit capital raising plans, aimed at ensuring compliance with the KES 10.0 billion core capital threshold by 2029, underscores the regulator’s commitment to maintaining financial stability.
As of the first quarter of 2025, a significant portion of the banks already meet this requirement, while others are working towards achieving the minimum capital levels by the set deadlines.
The sector may also witness increased mergers and acquisitions, capital raising, and privatization activities, especially among tier 3 lenders.
In terms of liquidity, banks have been actively managing their investments in government securities. Standard Chartered posted the quickest jump in investment in Kenyan government securities, while KCB Group diversified away from sovereign papers in the period.
Several other banks, including Absa, I&M Group, Stanbic, Equity Group, Co-op Bank, DTB, and NCBA, also increased their investments in government paper, reflecting varying strategies in managing their liquidity positions.
Tier 3 Banks in Kenya
When a Tier 3 bank successfully meets its capital requirements, it signals a few key things:
- Financial Stability: It shows the bank has a solid financial foundation, with enough capital to absorb potential losses. This builds confidence among depositors, investors, and other stakeholders.
- Increased Lending Capacity: With a stronger capital base, the bank can potentially increase its lending activities. This can stimulate economic growth by providing more credit to businesses and individuals.
- Reduced Risk of Failure: Meeting capital requirements lowers the risk of the bank becoming insolvent. This protects depositors and the financial system as a whole.
- Regulatory Compliance: It demonstrates that the bank is adhering to regulatory standards, which is essential for maintaining its license to operate.
Not Meeting the Requirements Failing to meet capital requirements has significant negative implications:
- Regulatory Actions: The bank will likely face regulatory scrutiny and intervention. This could include restrictions on lending, asset sales, or even the requirement to raise additional capital within a specific timeframe.
- Loss of Confidence: Failure to meet requirements can erode confidence in the bank, potentially leading to a run on deposits or a decline in the bank’s stock price.
- Increased Risk of Failure: Banks that don’t meet capital requirements are at a higher risk of failure, which can have serious consequences for depositors, the economy, and the financial system.
- Limited Growth: The bank may be forced to limit its growth or even shrink its operations to conserve capital.
Impact
Private Sector:
Businesses: Changes in CBK rates directly affect businesses’ borrowing costs. Higher rates can make it more expensive for companies to secure loans for expansion or operations, potentially slowing down investment and growth.
Conversely, lower rates can stimulate borrowing and economic activity. Asset performance and NPL levels indirectly influence businesses through the availability and terms of credit. Banks with strong asset performance and low NPLs are generally more willing to lend and offer favorable terms. High NPLs can make banks more risk-averse, leading to tighter lending standards.
Efficient operational expense management by banks can translate into better services and potentially lower fees for businesses.
Businesses face the challenge of adapting to fluctuating interest rates and credit conditions. Initiatives could include diversification of funding sources, hedging strategies to manage interest rate risk, and efficient financial planning.
Impact on Consumers:
Individuals: CBK rates impact consumers through mortgage rates, personal loan rates, and the returns on savings accounts. Higher rates increase the cost of borrowing for homes, cars, and other needs, potentially reducing consumer spending.
Lower rates can make borrowing more affordable, boosting consumer demand. Asset performance and NPL levels influence the stability and reliability of banks, which in turn affect consumers’ confidence in the financial system.
Operational efficiency affects the quality of services and the fees consumers pay for banking services.
Consumers must manage their debt responsibly and make informed financial decisions.
The trends in CBK rates, asset performance, NPLs, and operational expenses have multifaceted effects on both the private sector and consumers. Businesses and individuals must proactively manage risks, adapt to changing economic conditions, and make informed financial decisions to thrive in this environment.