Stanbic Bank Kenya posted a 10.1% year-on-year decline in after-tax profits to KES 6.4 billion in 1H25, weighed down by a steep drop in non-funded income particularly from forex trading.
Despite this, the bank’s core lending business showed resilience, with net interest income rising 14.3% y-o-y to KES 14.0 billion.
Stanbic’s Interest Income
The growth in net interest income was underpinned by a 35.3% y-o-y drop in interest expense to KES 7.9 billion, offsetting a 10.5% decline in interest income to KES 21.9 billion.
This cost efficiency nudged the net interest margin up to 6.3% (1H24: 5.7%), even as asset yields fell by 219 bps to 10.4%. The cost of funds also eased by 279 bps to 4.1%, reflecting improved funding dynamics.
Non-Funded Income
Non-funded income fell 32.8% y-o-y to KES 5.1 billion, largely due to a 58.2% plunge in forex trading income to KES 2.0 billion. Fees and commissions on loans rose modestly by 2.9% to KES 2.5 billion, while other operating income surged 43.4% to KES 633.1 million. Overall, non-funded income’s contribution to total income dropped by 1,153 bps to 26.6%.
Operating Costs & Asset Quality
Operating expenses (excluding provisions) rose 13.3% y-o-y to KES 9.1 billion, driven by a 2.3% uptick in staff costs and a 28.2% surge in other expenses. This pushed the cost-to-income ratio to 47.5% (1H24: 40.4%).
Loan loss provisions declined 14.8% y-o-y to KES 1.6 billion, lowering the cost of risk to 1.4%. Gross NPLs edged down 1.8% y-o-y to KES 23.9 billion, though the NPL ratio ticked up slightly to 9.3%. Provision coverage improved to 76.0%, up 878 bps y-o-y.
Commenting on the half-year performance, Stanbic Holdings CEO Dr. Joshua Oigara remarked:
“The Kenyan economy remained stable amidst persistent headwinds. Nonetheless, some pressures persist as evidenced by sluggish private sector credit uptake, high fiscal deficits and geopolitical risks. Our focus in this period was largely on supporting our clients navigate shifting market conditions, while fortifying our growth through robust risk management, capital strength and well-managed liquidity levels. We believe that our business will continue to demonstrate resilience and keep momentum even as the market continues to post recovery.”
Stanbic’s Balance Sheet Movements
- Customer Loans: Down 2.2% y-o-y to KES 233.0 billion
- Investment Securities: Up 45.4% y-o-y to KES 95.1 billion
- Customer Deposits: Down 2.5% y-o-y to KES 346.9 billion
- Borrowed Funds: Up 57.6% y-o-y to KES 19.0 billion
Valuation & Returns
Stanbic Holdings trades at a trailing P/E of 5.5x (industry median: 4.2x) and a P/B of 1.1x (industry median: 0.8x). Its return metrics remain robust, with ROE at 20.2% and ROA at 2.8%.
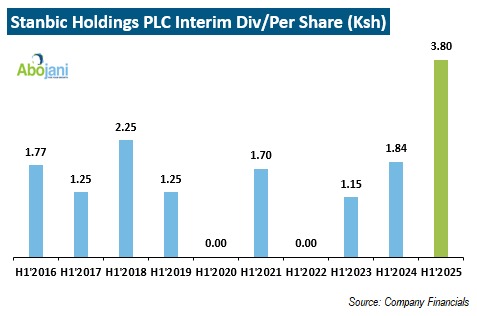
Dividend Boost
Despite the profit dip, shareholders have reason to smile. The Group declared an interim dividend of KES 3.80 per share more than double the KES 1.84 paid in 1H24. The dividend will be paid on or about 29th September 2025 to shareholders on the register as at 2nd September 2025.